Journalctl: How to Read and Edit Systemd Logs
Introduction
Systemd logs all Linux messages from the kernel and system processes. The journalctl command enables viewing and editing the systemd logs, making it a powerful tool for service and process debugging.
This guide shows how to read, control, and maintain systemd logs using journalctl through examples.
- Access to the command line/terminal window.
- A text editor (such as nano) to edit the config file.
- A user with sudo privileges (see how to add a user to sudoers).
What Is Systemd?
Systemd is a Linux service and system manager. While users do not invoke systemd directly, the manager contains many tools and daemons to run individually for various system processes.
One of the most powerful systemd functionalities is the logging features. Systemd provides a centralized solution for logging all kernel and user processes through logs known as journals.
The journald daemon collects all the messages the system outputs and then creates journals, regardless of the program or process. The daemon gathers data from all available system resources and stores them in a binary format.
Note: Binary format allows manipulating the output to suit your needs, providing more flexibility than traditional Linux log files.
journalctl Syntax
The
journalctl
command queries and manipulates the journal data collected by the journald daemon. The tool is vital for system administrators and complements other Linux logging tools and Syslog server software solutions.
The command syntax is:
Without any parameters, the
journalctl
command outputs the entire journal contents starting from the oldest entry. The
<match>
is one or more space-separated arguments for filtering the output fields. The format is
"FIELD=VALUE"
.
journalctl Options
The table below summarizes common
journalctl
options:
| Option | Description |
|---|---|
-a
--all
|
Show all fields fully, including unprintable characters. |
-f
--follow
|
Shows the most recent entries and prints new ones continually. |
--no-full
|
Truncates the output. |
-e
--pager-end
|
Jumps to the pager end. |
-n <number>
--lines=<number>
|
Shows the most recent entries limited to
<number>
of events. Without an argument, the default is ten (10). |
-o <format>
--output=<format>
|
Displays the journal entries in the requested
<format>
. |
--utc
|
Shows time in Coordinated Universal Time (UTC) format. |
-x
--catalog
|
Adds explanation text to log message where available. |
-q
--quiet
|
Suppresses informative messages in the output. |
-b [<ID> or <+-offset>]
--boot[=<ID> or <+-offset>]
|
Shows logs from a specific boot. Omitting the argument shows the current boot logs. |
-k
--dmesg
|
Shows only kernel messages. |
--list-boots
|
Displays a table of boot numbers and their IDs. |
-g <regex>
--grep=<regex>
|
Filters the output according to the grep regex syntax. |
-S <date>
,
-U <date>
--since=<date>
,
--until=<date>
|
Shows entries newer or older than specified date. |
-u <unit|pattern>
--unit=<unit|pattern>
|
Show logs for specified systemd unit or any unit matched by the
<pattern>
. |
--disk-usage
|
Calculates and displays total journal size on disk. |
--vaccuum-size=<size>
|
Limits the archived journal file size to <size>. |
--vaccuum-time=<time>
|
Limits the archived journals to newer than <time>. |
--no-pager
|
Disables the pager and displays as standard output. |
Check the
journalctl
manual page using the man command for a full list of options.
How to Read systemd
The following section outlines how to read systemd logs and use the various display options for the
journalctl
command. The output is different for every machine since records for every system are unique.
Display All Journal Entries
To show all journal entries, use the
journalctl
command without any options:
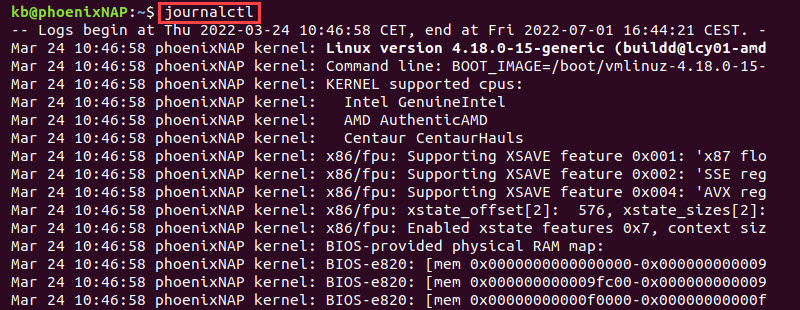
The first line from the output shows the time range of the log data. The columns contain the following data in order from left to right:
- Date and time.
- Host.
- Log source.
- Log message.
The journal data contains many entries. Use the arrow keys (similar to the less command) to navigate.
Exit the journal by pressing q.
Show Most Recent Entries
The
journalctl
command shows the oldest entries by default. To jump to the pager end and display the most recent entries, use the
-e
option:

The output shows the final 1000 entries to save space.
To control how many lines display in the output, use the
-n
option followed by the number of lines. For example, to show the five most recent journal entries, use:

The
-e
option is unnecessary and implied by the
-n
option. Omitting the number shows the ten most recent entries by default.
Limit the Logs to the Specific Boot
To limit the logs to the current boot, use the
-b
tag without any parameters:

Without any parameters, the command shows current boot logs.
Jump to a specific boot by adding an offset parameter. For example, show the previous boot logs with:
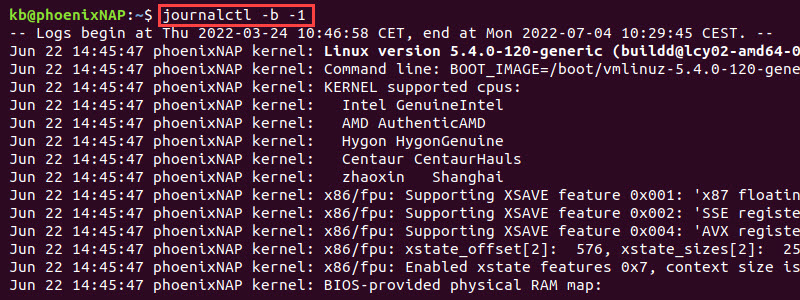
Alternatively, show the oldest available boot log with:

An alternative way to see a specific boot is to use a boot ID. Fetch the boot IDs using
--list-boots
with:

The first column displays the negative offset number, while the second column fetches the boot ID. Copy the ID and add it as a parameter to the command, for example:
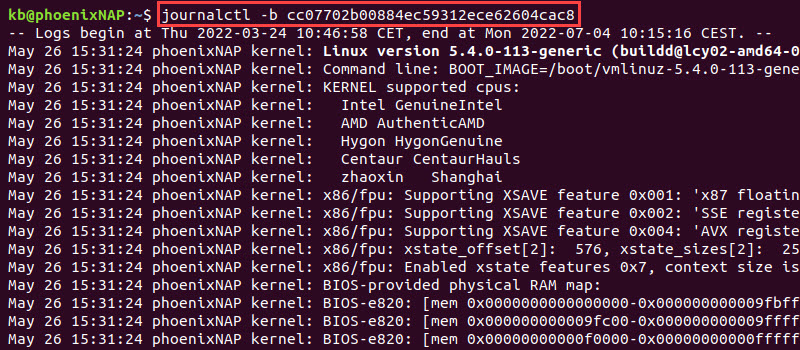
The output limits the log display to the provided ID instance.
Display Logs Within a Specific Time Window
Filter the journal by specifying a time limit. The two options for limiting since or until a specified time are:
Use the options individually or combine them to create a time window.
The command expects one of the following date and time formats:
- Specific date and time, for example,
2022-04-30 09:20:00. Omitting the time parameter defaults to00:00:00. - Strings, such as
"yesterday","today","2 hours ago", or"now".
Below is an example
journalctl
command with a specific time window:

The command creates a time window from April 2nd, 2022, to April 22nd, 2022. The output shows journals that fall into that timeframe.
Alternatively, use a string pattern such as:
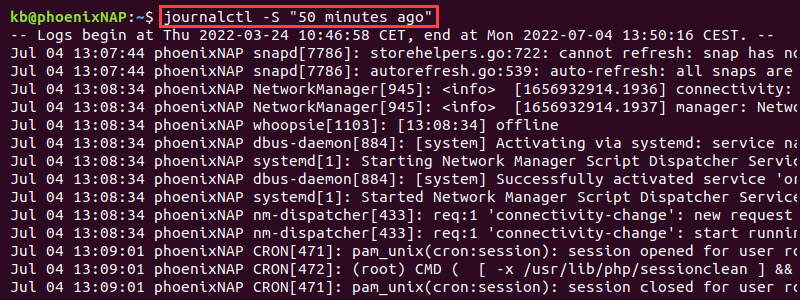
The output shows logs from the stated time up until the current time.
Display Logs By Specific systemd Unit
Filter the logs by the specific systemd unit using the
-u
tag and providing the unit name. For example, to filter only the Jenkins service unit records, run:
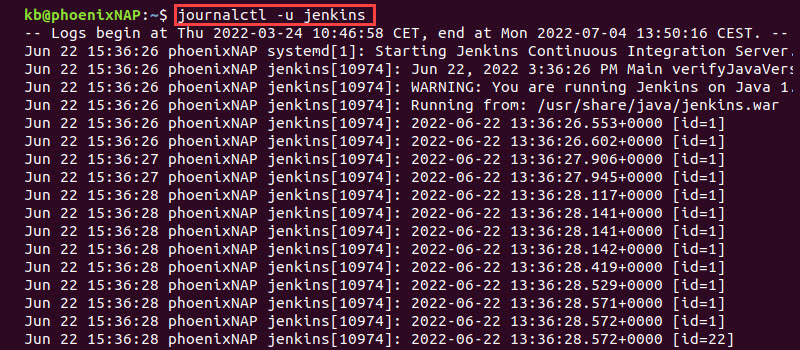
The output shows the journal entries related to the specific systemd unit (in this case, Jenkins).
Note: To display all the currently active systemd units, use:
Display Kernel Messages
To display only the kernel journal log messages, use the
-k
option:
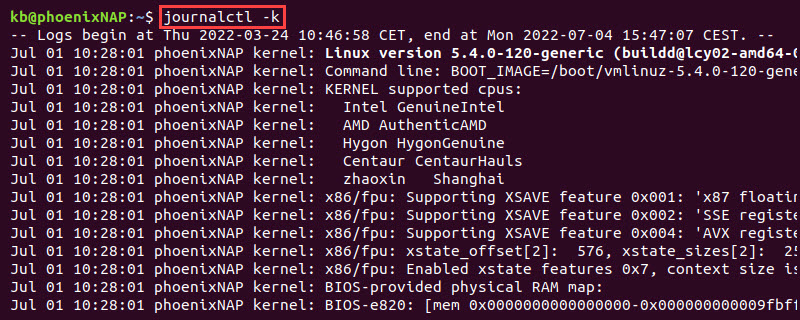
The output shows the kernel messages only from the current boot, applying the
-b
tag. To find kernel logs from a different boot session, add the
-b
tag and search for a specific boot.
Follow Logs
Use the
-f
or
--follow
tag to print the most recent logs continuously:

The output prints the logs as they generate in real-time. The option allows monitoring the logs with
journalctl
as they append.
To exit the viewer, press CTRL+ C.
Filter Log Messages Based on Priority
Filter the log messages by priority using the following command:
The following priorities exist:
- Emergency -
0oremerg - Alert -
1oralert - Critical -
2orcrit - Error -
3orerr - Warning -
4orwarning - Notice -
5ornotice - Inform -
6orinfo - Debug -
7ordebug
A lower number indicates the highest priority messages. Specifying a single-level priority also shows all lower priority number (more critical) logs.
For example, to display alerts, use:
Or alternatively:

The output displays only messages at the alert level and more important ones (if any).
Filter Log Messages Based on a Specific User
To see logs for a user, fetch the user ID (UID) with:

To fetch the ID for the current user, omit the
<user>
. The output shows the UID value for the given user. Use the UID journal field to filter log messages based on the specific user:
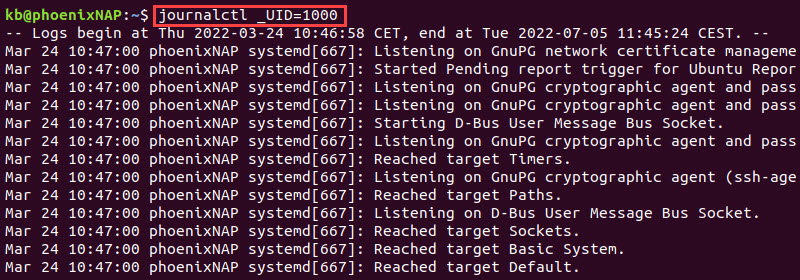
The output filters the journal log based on the specified user ID.
Note: For a full list of fields, check the
systemd.journal-fields
manual page:
How to Edit systemd Log Output
An essential aspect of working with logs as a system administrator is formatting the log outputs. Systemd offers many methods to manipulate the visual result and fetch the data in the desired format.
Below are some standard output editing options and examples.
Output to Standard Out
The
journalctl
command displays the output using a pager. Disable the pager with:
The resulting output is in standard output (stdout). Use this option when parsing the log data with text editing tools or Bash scripts.
Truncate or Expand Output
The
journalctl
pager shows expanded journal events in the output. Pressing the right and left arrow keys helps navigate the text that doesn't fit the screen size.
To limit truncate the
journalctl
output, use the
--no-full
option:

The output limits the lines to the screen size, adding ellipsis (
...
) to indicate a truncated display.
Output Formats
The
journalctl
command offers various options for output formats. The syntax for output format is:
Some of the available formats include:
-
cat- Displays only the message field. -
export- Outputs binary format, suitable for backups. -
short- Generates an output similar to classic Syslog files. -
short-precise- Displays time with microseconds. -
json- Formats journal entries into single-line JSON entries. -
json-pretty- Formats into JSON structures in multiple lines.
For example, to display using the
json-pretty
format, use:
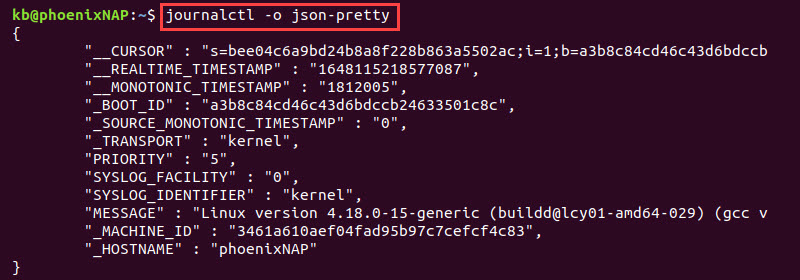
Different formats allow using the log data in databases, script files, or parsing it through monitoring software.
Log Maintenance
Storing log data comes at a cost and takes up space. Below are some tips and tricks to discover the disk usage, maintain log data files, and free up space used by old log files.
Display Disk Usage
To check the journal disk usage, run the following command:

The output shows the disk's total occupied space by archived and active journals.
Delete Old Logs
Delete old log archives by setting the desired size limit. The command requires sudo to delete the files /var/log/journal.
For example, set the size to 1M with:

Enter the sudo password and press Enter. The output prints the file names and sizes, and the last line shows the amount of freed memory.
Alternatively, delete archived logs based on time. Any files older than the set time delete and free up memory. For example, to delete files older than two months, run:
The time suffixes are
s
,
m
,
h
,
days
,
months
,
weeks
, or
years
.
Limit the Journal
The journal configuration file allows setting limits and controlling how much journald data takes up on disk. To edit the file, run:
The file contains example configuration fields. The following parameters deal with the journal size and memory limits:
-
SystemMaxUse- Maximum persistent storage used by the journal. -
SystemKeepFree- Amount of free space a journal leaves when adding entries to persistent storage. -
SystemMaxFileSize- Sets the maximum size for journal files in persistent storage. -
RuntimeMaxUse- Maximum volatile storage disk space. -
RuntimeKeepFree- Amount of free space for other uses when writing to volatile storage. -
RuntimeMaxFileSize- Sets the maximum size for journal files in volatile storage.
File size controls target archived files to reach the limits. Uncomment the lines and set the limits to gain better control over the machine storage and consumption resources.
Conclusion
This guide showed how to view, control, and manage systemd journal logs through examples. The
journalctl
command is a valuable tool that helps troubleshoot Linux services and discover system errors.


Nhận xét
Đăng nhận xét